A Practical Workflow for Turning Technical Notes Into Clear AI Diagrams
Technical work often begins as messy notes. A developer writes down API behavior during testing. A support engineer records the steps that led to a bug. A product manager collects edge cases from customers. A security reviewer lists trust boundaries and data handoffs. These notes are useful, but they are rarely easy for another person to understand quickly.

This is where diagrams help. A good technical diagram turns a scattered set of observations into a shared mental model. It can show which systems interact, where data moves, what happens first, and where risk or ambiguity still exists. The challenge is that many teams wait too long to create diagrams. They write pages of documentation first, then add a visual at the end because the document feels incomplete.
A better approach is to make diagramming part of the technical note-taking workflow itself.
Why are technical notes hard to reuse
Raw notes usually reflect the order in which someone discovered information, not the order in which a reader needs to understand it. For example, notes from debugging may include log snippets, screenshots, error messages, API responses, guesses, deployment times, and comments from multiple teammates. Each item may be accurate, but the structure is weak.
The same is the issue with architectural planning. Requirements, dependencies, constraints,s and open questions can be captured in a document as a team. Many of the most critical relationships occur between paragraphs, however:
- Which service owns the data?
- Which component calls which API?
- What happens when a request fails?
- Which dependency is optional and which is critical?
- Which team needs to approve a change?
If these relationships cannot be seen, readers must draw them out in their minds. This slows down reviews and raises the likelihood of miscommunication.
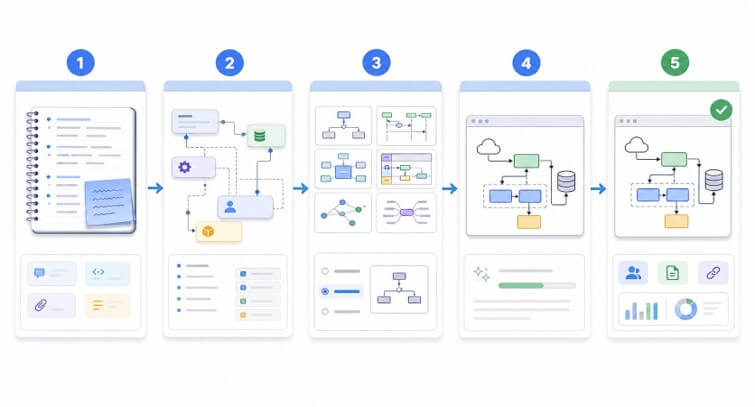
Start by finding the nouns and verbs.s
Separate your notes into two easy-to-follow lists: nouns and verbs, before drawing a diagram.
The entities in the system are nouns. These can be anything from components and users to tools, databases, teams, documents, APIs, queues, alerts, or external services.
The verbs are used to express relationships or actions. These can be sends, receives, validates, stores, transforms, retries, approves, rejects, notifies, deploys,s or monitors.
For instance, a simple note like “The mobile app provides an s image of the receipt to the backend, the backend extracts the text, and the finance dashboard is displayed after reviewing” can be transformed to:
- Nouns: mobile app, backend, receipt image, extraction step, review queue, finance dashboard
- Verbs: sends, extracts, reviews, publishes, displays
This is a very simple division, and the first drawing is much easier to draft. It also identifies gaps. If there is a noun that has no relationship, it does not necessarily need to be included in the diagram. If there is no owner for an action, then the action may be underspecified.
Choose the diagram type based on the question.
Usually, many teams ask themselves the question: “Should this be a flowchart, architecture diagram, sequence diagram, or mind map?” This is typically the wrong initial question.
Well, the better question is: “What should the reader have an understanding of it quicker after seeing this?
When there is a need to understand the order, use a Workflow or Sequence diagram. Use a swimlane diagram if it is necessary for the reader to grasp who owns. For dependency, use the architecture or component diagram. For comparison: If the reader has to compare options, choose a side-by-side decision diagram.
For technical notes, the most useful diagram types are often:
- Flow diagrams for step-by-step behavior
- System diagrams for services and dependencies
- Data flow diagrams for inputs, transformations, and outputs
- Swimlane diagrams for handoffs between people, tools, or teams
- Before-and-after diagrams for migrations or refactors
Choosing the diagram type after defining the reader’s question keeps the visual focused.
Use AI to create a first draft, not the final text.h
AI tools can speed up the first version of a diagram. If your notes already contain clear entities and relationships, an AI diagram generator for technical teams can turn them into a cleaner visual starting point without forcing someone to manually place every box and arrow.
The keyword is “starting point. A review is required for technical diagrams. A generated diagram might be a pretty diagram, but still not have a dependency, or an arrow pointing the wrong way, or be missing critical failure paths. Treat the output as you would treat code generated: It can help you,u but it won’t be correct by itself.
After generating a draft, review it with these checks:
- Are all the important components present?
- Are the arrows pointing in the right direction?
- Does the diagram show the right level of detail?
- Are labels specific enough to be useful?
- Did the tool invent anything that was not in the notes?
- Can a new teammate understand the main idea in under a minute?
If the answer is No, tweak the notes and re-create or tweak the diagram.
Keep one diagram tied to one job.
One frequently made error is attempting to create one diagram to answer all the questions. Typically,y this results in clutter. Not all of the product’s requirements are necessary for a deployment architecture diagram. Not all of the database tables are required for a product workflow. A debugging diagram doesn’t always require all the future enhancements.
One diagram should have one job. For example:
- “This diagram explains how the current upload flow works.”
- “This diagram shows where the incident occurred.”
- “This diagram compares the old and new data pipeline.”
- “This diagram lists the approval steps before release.”
If two questions are shown, draw two diagrams. Two simple diagrams are better than one bloated diagram.
Add the diagram back into the notes.
A diagram should not be detached from the source notes. Place it in the document, ticket, pull request, post-mortem,m or planning page where the discussion is taking place. Write a brief explanation below it.
The explanation should answer three things:
- What the diagram shows
- What it intentionally leaves out
- What decision or next step does it support
This context makes this visual an unsuitable interface for future users to use as a system map, since it was only intended to clarify one workflow.
A reusable prompt format
A lot can depend on the structure of the input when using AI to create a technical diagram. Here’s a helpful reminder:
“Create a diagram for [audience]. The goal is to explain [question]. Use these components: [list]. Show these relationships: [list]. Highlight these constraints: [list]. Keep the diagram simple enough for [use case].”
For example:
Draw a system diagram for a backend engineer to review a feature that transforms images. You should include the following elements: browser, API, validation step, job queue, image worker, result storage, sand tatus endpoint. Make sure to include success and failure paths, and make it easy enough for someone to read the PR description.
This prompt is used to structure the tool and to avoid having vague output.
Final thought
Technical diagrams are not nice to look at. They have the function of compressing reasoning. They organize teams to convert jumbled notes into something that’s easier to review, reuse, and discuss.
The easiest way to do it is to just take notes, identify the entities and the relationships between them, select the question, write a preliminary version, read through it thoroughly, and then put the completed diagram on the supporting decision. If teams become accustomed to this practice, technical documentation writing will become quicker and more believable.
Popular on OTW Right Now!


About The Author
Gagan Bhangu
Founder of otechworld.com and managing editor. He is a tech geek, web-developer, and blogger. He holds a master's degree in computer applications and making money online since 2015.