
From Research Paper to Publication-Ready Graphics: How AI Is Transforming Graphical Abstract Creation
The visualization of science is more important than ever. Several scientific journals, conferences, and research institutions nowadays are asking authors to provide graphical abstracts along with the articles to impart complex findings to the readers. But for the scientist with limited design skills, creating a professional scientific illustration can be a challenge.
Rather than spending hours manually developing figures, researchers may now use an AI-powered graphical abstract maker to create clear, publication-ready images in a fraction of the time. This gives students more time to concentrate on their research while also presenting their findings in a professional and engaging manner.
Why Graphical Abstracts Have Become Essential
A graphical abstract is no longer just an option; it is kind of a necessity in research papers. Lately, quite a few publishers have adopted visual summaries that help readers get the study’s gist, the methodology, and the results quickly. These kinds of graphics also help research become easier to spot when it is posted on conference slides, institutional websites, newsletters, and social media. A visually attractive graphical abstract can capture the attention of readers, motivate others to read the whole paper, and deliver scientific communications a big boost in effectiveness, regardless of the target audience.
The Design Challenges Researchers Face
Researchers have an area of expertise, but there are very few who have specific training as graphic designers. Honestly, a lot of the time, it is necessary to start from scratch, and then you are basically crafting a scientific illustration. It might start right away in PowerPoint with a blank canvas, or you can open Illustrator and just work from a blank sheet. But then you have to put in everything one by one: shapes, these small icons, connectors, and even the plus labels, which drags out and becomes slow and repetitious, like this boring loop. Finally, researchers frequently find themselves spending more time dealing with the images than correctly communicating their findings, which feels somewhat backward.
Starting with a Blank Canvas
One of the frustrations is organizing complex scientific data without losing its essence in a simple visual representation. All this information should be contained in a research paper (methods, experiments, results, and conclusions); presenting all of this information in one figure is not easily done. Many researchers are seemingly moving things around, resizing diagrams, and redesigning the layout several times without having a structured workflow. If there is no workflow in place, many researchers are constantly moving objects around, redesigning layouts, and resizing diagrams until they are able to get their point across.
Searching for Icons and Maintaining Balance
Ideally, scientific figures should also have icons, symbols, and illustrations that strongly convey the particular concepts of scientific research. These are resources obtained from various libraries that will not always be as stylized as one another and will take time to find. Having chosen a suitable set of visuals, researchers have to make adjustments for a balanced visual layout, including spacing, color, fonts, and alignment. Small design task elements can add up to a lot of time in the production of one graphical abstract.
How AI Simplifies the Entire Process
This was the case until the introduction of AI, which now revolutionizes the ability to convert research into a structured scientific visual in just a few seconds. The design software has been created especially for researchers who require graphs and diagrams that look professionally ready and require less time than they would spend working with the design software to create. It doesn’t start from scratch; it works with the existing content in your research and constructs a structured visual outline that can be reviewed, edited, and finalized.
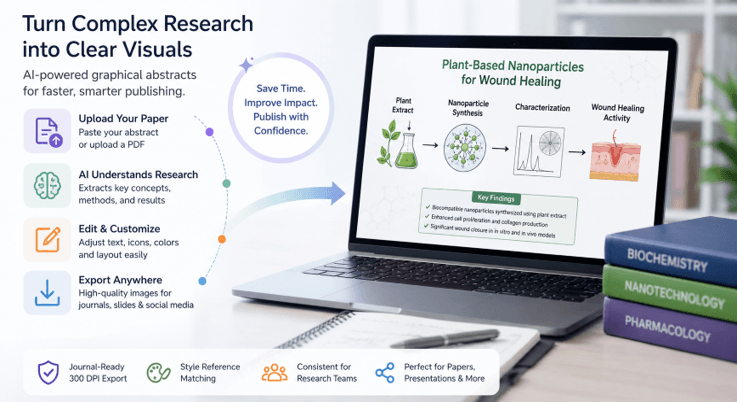
Create a Graphical Abstract in Four Simple Steps
Step 1: Paste Your Abstract or Upload a PDF
The process begins with flexible input options. Researchers can choose to paste the abstract text straight into the platform or upload the full research paper as a PDF. This kinda flexibility makes it fit different writing workflows, and it also removes the need to manually copy the information into design software first before creating a figure.
Step 2: Let AI Generate the First Draft
After the document is uploaded, the AI system kind of goes through the research, trying to spot the most crucial concepts and the important interactions; then it also looks for the overall pattern, like how the study actually moved forward from start to finish. It instantly creates a scientific schematic that is easy to read and understand from a given logical and coherent text. Researchers don’t have to manually draw each part; they’re getting a robust and solid initial draft ready for tweaks!
Step 3: Review and Edit Every Element
Each research project is different, and full flexibility of editing is a must. Driven by a requirement to have visual and verbal-based data labels, terminology, icons, colors, layout, and the flow of the data that best represent their research, researchers are easily able to change terms, colors, layout, etc., until it meets the standards of the research. Users can upload a “style image” so the AI can match a visual style used in other publications, for consistent output playback across various projects.
Step 4: Export for Publication, Slides, or Social Media
Once the graphical abstract is ready, it can be exported in a bunch of different formats that fit different uses. The solid 300 DPI option is especially good because those exports generally meet journal requirements, and the same figure can also be used later in presentations, like at conferences, in lecture slides, on institutional websites, or even shared on social media, so there is no need to craft several separate versions over and over again.
Supporting Consistent Visual Communication Across Research Teams
When several researchers contribute figures to various publications, the issue of maintaining a consistent visual identity becomes a problem. The frequency and diversity of fonts, colors, icons, and layouts often seem inconsistent from one project to another, falsely or confusingly so, making the laboratory’s research look that way. The frequency and diversity of fonts, colors, icons, and layouts often appear inconsistent from one project to another, falsely or confusingly so, making the laboratory’s research look like this. Using a dedicated graphical abstract generator helps research groups maintain a unified style across publications while allowing every team member to produce professional-quality figures more efficiently.
Where Researchers Can Use AI-Generated Graphical Abstracts
The value of graphical abstracts is now much greater. The same visual artwork may be displayed in multiple conference presentations and used to give the audience a better grasp of the complexity behind the studies and their findings in seconds. They also enhance teaching resources, departmental discourses, grant applications, and group gatherings with a clear summary of the research.
These visuals can also be used to promote research. There are many LinkedIn, X, ResearchGate, and other platforms that feature publications shared by universities, laboratories, and individual researchers, on which visual content is also put forward more than textual content. Researchers can use shareable and even animated graphical abstracts to get others, beyond the scientific circle, to understand their research in a professional scientific manner.
Final Thoughts
Designing a professional graphical abstract today doesn’t need to be a time-consuming and back-and-forth process of manual efforts, formatting, and revisions. With AI-driven science content comprehension and fully editable scientific visuals, GAAbstract enables researchers to convert complex papers into publishable graphics, conveniently and quickly. From writing your next scientific article to creating presentations for conferences, all the way to sharing research online, there’s a practical benefit to the platform that helps you save time for better science communication.
If you wish to save time on finding those design tricks and more on studying, then giving GAAbstract a go without paying for credits will come in handy if you’re a new user.
Popular on OTW Right Now!




About The Author

Gagan Bhangu
Founder of otechworld.com and managing editor. He is a tech geek, web-developer, and blogger. He holds a master's degree in computer applications and making money online since 2015.