
How Researchers Can Convert PDF to PowerPoint Free for Academic Conferences
Turning a dense, peer-reviewed journal article into an engaging conference presentation is a huge milestone for any researcher. You test things for months, maybe years, deal with data, and make it through the peer-review process. You run experiments for months, maybe years, survive data analysis, and go through the peer-review process. After this comes the reward – you are invited to present your work at a big international conference or a departmental seminar.
But this transition introduces a frustrating technical headache. Academic publishing relies almost entirely on the static, two-column PDF format. On the flip side, oral defenses and conference presentations run on dynamic PowerPoint slides.
It’s a slow process to get content from that PDF into the slide deck for a busy academic. Copying text blocks, retyping lengthy maths notation and shooting poor snapshots of data charts consume precious hours. That’s the time to be honing your speech or experiment in the lab, and the outcome is invariably a stumbling, amateurish performance on the large screen.
You need a smarter solution for handling this file migration to ensure your data gets delivered with your credibility and that it gets to your audience. This guide breaks down exactly why academic documents are so hard to modify, and offers practical, real-world ways to convert PDF to PowerPoint for free without losing your formatting, ruining your charts, or risking your data privacy.
Why Academic Papers Fight Back Against Standard Converters
Anyone who has ever used a general online journal article-to-file conversion program knows that it’s typically a catastrophe. Not only does the formatting go a bit haywire, but the layout does as well. This is because, like PowerPoint slides, academic publications are printed densely, which is quite different from the way they are designed. The standard conversion program can only handle a scholarly PDF file with three significant hurdles.
The Column Order Mess
Most major publishers like IEEE, Elsevier, or Nature format papers in strict side-by-side columns to fit more text onto a physical page. This is where standard converters immediately trip up.
The standard file converter will read across the page, left to right, as if the vertical gutter in the middle of the page were not there. Therefore, the software stitches the end of a line in the left column with the start of a line in the right column. Once you start your new presentation, your sentences are jumbled all together. This is more time-consuming than retyping the entire thing by hand, paragraph by paragraph.
Scrambled Equations and Unicode Errors
The math is the key part of the entire presentation, for anyone who works with STEM or quantitative disciplines. Academic PDFs include complex elements such as matrices, integrals, and fractions in custom font profiles or by generating vector paths with LaTeX.
With simple PDF to PowerPoint free conversion software, it is unlikely that the software understands how to convert these custom symbols into standard Office symbols. Your slides are filled with weird formatting issues, broken code strings, or those empty boxes with a square in them that indicate a missing font. Your slides are littered with weird formatting issues, broken code strings, or those empty boxes with a square in them that indicate a missing font. To fix them, you need to sit there with the PowerPoint equation editor and manually re-create each formula.
Blurred Charts and Lost Resolution
All the charts you make with R, MATLAB, or Prism are high-quality vector images (with a very high zoom factor; you can zoom in forever, and the lines will remain crisp). That’s the kind of clarity you want when presenting to an audience that is seeking tight error bars or small data points.
The downside of using cheap or simple conversion software is that it can’t deal with these graphic layers. It only captures a low-resolution picture of the chart to conserve processing power and then flattens the chart to create a compressed JPEG. When this picture is displayed on a big screen in a conference room, it appears blurry and pixellated. Audiences cannot read your axis labels if you are unable to read them. Your data is instantly less credible if the audience can’t read the labels on your axes.
3 Free Ways to Convert Your Papers Under Tight Deadlines
Each researcher has their own set of constraints. It may be a casual slide presentation for a weekly lab meeting, or it may be a high-stakes slide presentation for a tenure review. These free strategies will help you accomplish whatever task you may need without spending a dime.
Option 1: Fast Web Tools for Casual Lab Meetings
When you need to review a peer’s paper for a weekly journal club or update your immediate team, speed is everything. You do not need absolute aesthetic perfection; you need editable text in a slide format quickly.
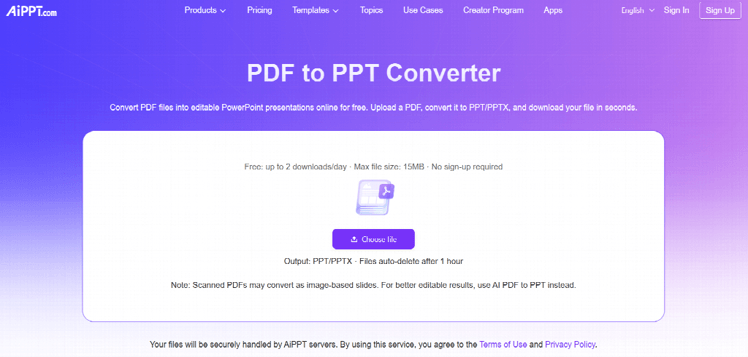
In this regard, it is best to use web-based tools that are capable of recognizing smart layouts, such as AiPPT.com (Adobe Acrobat’s free online portal) and Smallpdf.
- How to do it: Drop your file into the browser tool, choose PPT as your output, and let the cloud tool process it.
- The upside: It reads down the columns correctly, letting you convert PDF to PowerPoint for free in less than a minute so you can grab the text blocks you need without manual retyping.
Option 2: Vector Extraction for High-Stakes Talks
But when it comes to an important presentation or a big grant, blurry charts are unacceptable. A conversion tool is required that will isolate the text layers from vector graphics.
Advanced online or high-fidelity free desktop chart converters won’t turn your charts into images. Rather, they view each line, bar, and data point as distinct graphics on PowerPoint. This offers you tons of freedom. Scale up a chart to fit a widescreen slide with no loss of clarity. Oh, and it is possible to even recolor single bars to match your university’s presentation theme.
Option 3: OCR Processing for Old, Scanned Documents
For humanities or history workers or for those who are perusing the old medical archives, your PDFs probably represent the digital image of a paper document. The documents are not layered with a digital layer; they are simply photographs of the pages contained within a PDF wrapper.
These legacy papers require a tool that has the inbuilt capability of OCR. With AI-based OCR technology in place, it can recognize the shape of the printed ink and match it to learning sets to create clean and editable text free of noise. When you use an OCR engine to process your archival files, you can easily transform the PDF into a PowerPoint presentation and get the lecture file on which you can make text points that you can format as you like.
The “Conference-Ready” Optimization Checklist
While a good document converter will provide you with a good basis, it won’t create a nice-looking presentation for you. Academic slide design needs to be simple, readable, and have a clean pacing. With your converted PowerPoint file open, follow this four-step checklist to ensure your presentation is ready for the podium.
Step 1. Fix the Aspect Ratio
Most journal articles are written on standard A4 or Letter size paper – that is, on a boxy 4:3 format. Nevertheless, today’s lecture hall projectors and monitors are widescreen, 16:9.
The first thing you’ll see in your converted slides is that your content may be too small or the sides of the slide will be black.
How to fix it: Head over to the “Design” tab in PowerPoint > click “Slide Size” > select “Widescreen (16:9)”. Do a quick scroll through the deck to make sure this shift did not stretch your charts or distort your image proportions.
Step 2. Break Up the Walls of Text
Academic writing is so dense that it was common for them to have such small fonts as 10pt, so that as much information could fit on a page as possible. Don’t leave those long paragraphs as is on a slide; it will make for a dull presentation. Your audience will be reading the words you have on screen rather than hearing you speak.
You need to edit and trim that text aggressively:
- Turn heavy paragraphs into short, impactful bullet points.
- For conference rooms, make sure your body text is at least 24ptand your titles are around 36pt.
No one in the farthest row of the auditorium will have difficulty following you if your text is large and clear.
Step 3. Standardize Your Fonts and Math
If a software converts PDF to PPT, it will attempt to link the fonts in the original PDF to the fonts that are installed on your computer. If the font used in the journal is not a standard or proprietary font, the font will be replaced by a generic system font. This can lead to your text overflowing, which will distort your margins and clip your equations.
To clean this up, select your text boxes and switch them to clean, highly readable sans-serif fonts like Calibri, Arial, or Helvetica.
If a very complicated formula becomes garbled and scrambled in the conversion, skip it and don’t worry about it, since it will be untangled later. Return to the original PDF and use a high-resolution snapshot program to get a clear photo of only that equation and then paste directly into the slide. It will be a breeze to look great and will not have font problems.
Step 4. Protect Your Intellectual Property
Data safety can be particularly crucial, particularly if you are handling unpublished lab reports, pending patents, or confidential clinical trials. Sharing your cutting-edge discoveries with arbitrary online instruments could be a significant threat to your intellectual property.
Before you use any web tool to convert PDF to PowerPoint for free, take thirty seconds to look at their privacy policy:
- Reputable, professional free web services explicitly state that your files are fully encrypted during transmission.
- They should promise to completely delete your data from their servers within an hour of your download.
- If you are working under a strict non-disclosure agreement or a government grant with tight data restrictions, skip online tools completely. Use local (non-internet) desktop applications which are available as free software – this way your data stays on the local hard drive.
The approach is to concentrate on the science, rather than the tool.
Focus on the Science, Not the Tool
The real value of a researcher is in their thinking, their experimentation, and in the communication of their findings. It is a time-consuming and aggravating experience to get your margins, bullet points, and layout right.
Once you know how documents are set up in the academic world and select the proper conversion software for your application, you can eliminate the hassle of formatting. The correct workflow keeps your data charts extremely razor-sharp, safeguards your writing design, and ensures that your unreleased research remains safe.
In the end, these easy computer tricks will help you save time dealing with software and have more time to focus on crafting a presentation that’s clear, professional, and reflects your hard work.
Popular on OTW Right Now!



About The Author

Gagan Bhangu
Founder of otechworld.com and managing editor. He is a tech geek, web-developer, and blogger. He holds a master's degree in computer applications and making money online since 2015.