
Why business software needs trustworthy data before better dashboards
Businesses are collecting more data than ever, yet so many teams still can’t answer the most basic of questions. How many new customers did we have last month? Which accounts are active? Why do we have two dashboards giving us two completely different figures?
The problem isn’t always lack of reporting capability. Often the data that underpins the reports is incomplete, duplicated or out of date. A nice chart can make poor data look good, but it can’t make the data itself any better.
When you’re building or buying software, data quality and access to analytics are two sides of the same coin.
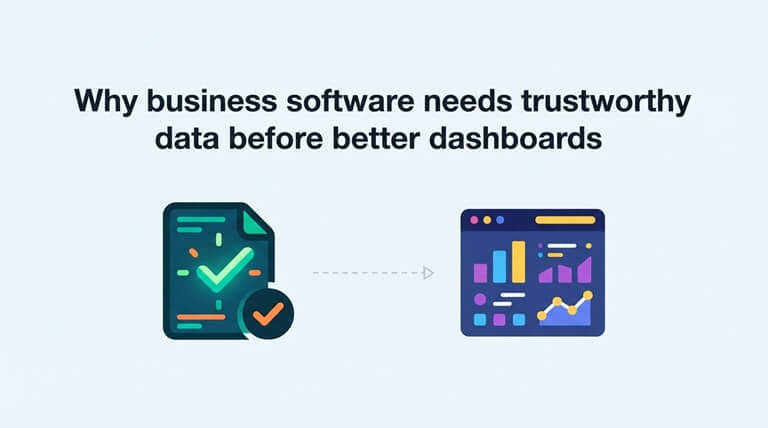
A dashboard is only the final step
Most teams just see the output of the data processing, not the work that went into it. The sales manager opens up a report that shows new contacts, conversions and revenue. The customer success team will be looking at account activity. The product manager will be looking at feature adoption.
Every report is reliant on records that have been collected elsewhere. If those records aren’t consistent, then the dashboard could very well be showing the wrong answer with confidence.
Think of a software company where every email signup is treated as a new prospect. Some of the emails have typos in them. Some are temporary/ghost. Some are clearly the same person just with a different spelling. The signup chart will go up, but the number of real prospects doesn’t go up by that much.
That’s why reporting projects should start by asking where each metric originates and what constitutes a valid record.
Contact data needs its own quality checks
Email addresses are a classic source of problems as they’re present in so many systems. They come in via newsletter sign-ups, trial sign-ups, event pages, sales imports, and customer databases.
A typo during the sign-up process can get embedded in the record as it moves through the CRM and into the various reports. Inactive or invalid addresses can also have a massive impact on campaign performance. The team may go down the subject line or targeting route, when in fact the issue is that some of the emails simply never had a chance of getting delivered.
Tools such as Bouncer can be used to validate email addresses as part of a workflow. They can check whether an email is valid and can also flag up any invalid or risky addresses. You can obviously do bulk checks on existing lists. Businesses evaluating email verification tools should consider how the checks fit into sign-up forms, imports, and routine database maintenance.
Verification doesn’t in any way guarantee that the person at that address wants to hear from your business, and it by no means replaces your consent rules. It merely answers a much smaller but still important question: is that address likely to work?
Clean records make performance metrics more meaningful
Suppose two campaigns each generate 1,000 new email addresses. One of them produces 900 usable contacts, the other 650. A report that’s based purely on raw signups would treat them as being equal.
When it comes to data quality the difference is very clear. The second campaign may well be picking up more low-quality sign-ups, or the form itself may be the problem. The marketing team can go and investigate the root cause rather than just celebrating the same headline number for both.
This goes beyond email. Duplicated customer records can inflate account numbers. Missing dates make it very difficult to work out retention. Inconsistent product names can cause sales to be split into different categories when they should all be in the same category.
Good analytics is all about having clear definitions that the team can explain and records that match those definitions.
Reporting is more useful inside the tools people already use
Even reliable data is of little use if you’ve got to leave your normal software to find it. A manager may be in a CRM and yet need a separate login to check on sales performance. A customer success person may well have to go out and export their data just to see what activity there is on an account.
This is where Luzmo’s embedded analytics capabilities come into play. Developers can add reporting experiences to their own applications so users can review relevant metrics without moving between disconnected systems. Teams assessing embedded analytics tools can look at how dashboards connect to application data, how access is controlled, and how much flexibility users have to explore results.
The aim isn’t to have a chart in every single place. It’s to have the right information in the right place next to the decision it’s supporting.
Different users need different answers
A company-wide dashboard can get very crowded, as every department wants its own metrics. Sales want their pipeline. Finance wants their revenue. Support managers want to know about their workload. Product wants to know about usage.
Embedded reporting allows you to build views for each job. A customer-facing app might be set up to show account owners their recent activity and their renewal trends. An operations dashboard might be set up to show processing times and the number of tasks that are still outstanding.
Access controls are just as important as visuals. Users should only be able to see the data that’s relevant to their account, their team, and their role. If you have a reporting feature that shows data across customers, it can be a real problem even if the charts are absolutely stunning.
For software teams, it means data permissions are absolutely fundamental to the analytics design, not something you just sort out after you’ve launched.
Make metrics traceable before making them attractive
When the two reports don’t match, you need to find out why. The fastest way to do that is to document the definition, source and update frequency of each metric.
Take ‘active customer’ as an example. Does that mean someone who logged in over the past 30 days? Someone who has made a purchase? Someone whose subscription is still active? All of those are plausible definitions, but if you mix them up you just end up with confusion.
It’s also useful to separate live operational data from scheduled reporting data. If one of your dashboards is updating every few minutes and another is only updating overnight, their totals will be different for a period of time even if nothing is actually wrong.
Clear labels and written definitions will help people not to waste meetings arguing about numbers that were calculated in different ways from the outset.
Build a simple data-to-decision workflow
A good workflow begins at data entry. You need to validate the fields, nip any obvious duplicates in the bud, and ensure that the required information is consistent. You then need to work out which system owns each record and how the updates flow between them.
After that, pick a few metrics that relate to actual decisions. The sales team might look at qualified contacts rather than every imported address. The product team might look at repeat use of a feature rather than total clicks. The ops team might look at the number of unresolved cases rather than the number of reports.
Right at the end of the process, get those metrics in a place where the right people can see them and use them. Check the numbers regularly and look at the underlying data if anything changes in an unexpected way.
Better reporting starts before the chart
Businesses tend to view analytics as a visual problem. They want better dashboards, more filters, quicker access to reports, etc. All of that is useful, but it only really matters after you’ve done the hard work of getting good quality data in the first place.
Accurate contact records will go a long way to helping teams work out who they can actually reach. Reporting within the very apps that people use every day will help the teams to make use of that data. Neither of those things on their own will solve the problem, though.
The best dashboard isn’t the one with the most graphs. It’s the one built on reliable data that helps someone decide what to do next.
Popular on OTW Right Now!
-
 How Businesses Can Reduce Risk When Choosing a New Office: A Practical Guide for Growing Businesses
-
 Why Agentic Workflow Systems Are Becoming the Next Evolution of Business Automation
-
 Beyond Survival: Building a Business Strategy That Thrives in Uncertainty
-
 How to Make Business SMS Messaging More Cost-Effective



About The Author

Gagan Bhangu
Founder of otechworld.com and managing editor. He is a tech geek, web-developer, and blogger. He holds a master's degree in computer applications and making money online since 2015.