Chrome URLs – List of All URLs, Uses, & Settings
Want to know about Chrome URLs and their purposes? Here is the list of Chrome URLs with their uses.
No doubt, Google Chrome is the best and most popular browser in the market with a 63.38% browser market share worldwide. Most people use it because it is a fast, secure, and simple browser and comes with Google’s smart built-ins.
However, its inbuilt functionality is enough for a normal user, but you can increase its functionality by installing and using apps and extensions. It offers Chrome Web Store where you can find extensions, apps, and themes for the browser. Both free and paid items are available in the Store. Apps and extensions make web pages more useful because you can add more features.
Well, Google added new features to Chrome regularly to improve browsing performance and experience. It has plenty of hidden features that normal users can’t find from the settings.
I’ve also shared about Chrome Flags which are hidden experimental features. You can use its beta version to preview and use upcoming features before the official release.
Well, after Chrome Flags, Chrome URLs are another from where you can access its hidden features. Before starting, you should know about Chrome URLs.
What are Chrome URLs?
Chrome URLs are internal pages of the browser that allow access to browser information, hidden features, and internal web pages that give information about the browser’s internals.
Mostly all web browsers offer internal URLs to access normal and advanced features. So, in Chrome, you can access and use internal pages for different purposes.
The webpages offered in URLs are for normal, advanced, and developer users.
Normal users can open basic features (like history, downloads, bookmarks, extensions, settings, etc.) of the browser directly by using URLs. Advanced users can get hidden features and the browser’s detailed information to fix/troubleshoot some issues. Similarly, some pages are available for debugging purposes for developers.
How to Access and Use Chrome URLs?
Well, Chrome URLs are started with chrome:// (followed by word) and you can open the page by typing the URL in the address bar (Omnibox).
There are more than 80 URLs available in the Chrome browser. All URLs are unique and it’s hard to remember all links.
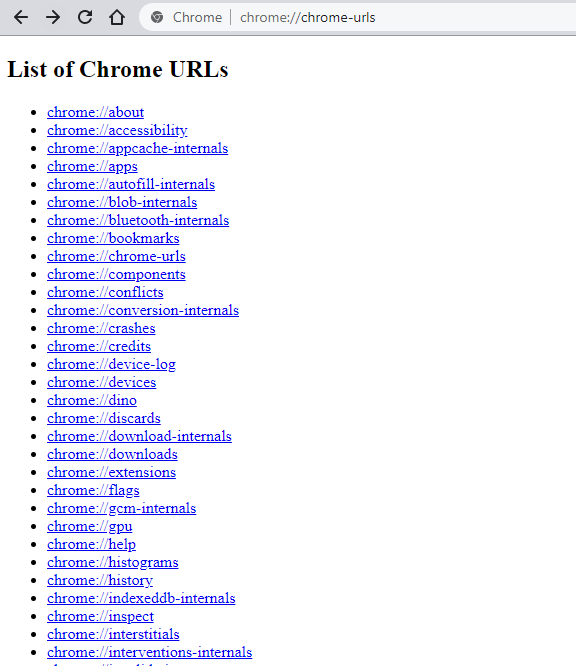
Chrome browser provides the menu or list of all available URLs. However, the purpose and the use aren’t mentioned on the page.
But, you can see the list by typing chrome://chrome-urls in the address bar. Alternatively, you can open the list by typing chrome://about.
List of Chrome URLs and their Uses
The Chrome browser gives the list of all URLs on one page by typing chrome://about or chrome://chrome-urls. But, for normal users, it may be arduous to understand the purposes.
So, the list is given below to know about all URLs with uses.
Let’s get started.
1. chrome://about
It shows the list of all Chrome internal URLs. By opening this link, you can see the page with all available URLs on the browser. From the page, you can easily find the page you want to open. This is the same as the chrome://chrome-urls link.
2. chrome://accessibility
The accessibility internal page allows you to inspect the internal representation of accessibility in a browser. It also allows us to see the accessibility tree for opened pages or tabs. You can also modify the accessibility modes. The available modes are Native accessibility API support, Web accessibility, Text metrics, Screen reader support, HTML, and Label images.
This feature is turned off by default and you need to turn it on manually. You must need to restart the browser to make the changes.
3. chrome://app-service-internals
The App Service Internals allow us to see the list of all installed apps with information on the Chrome browser. Note that Chrome apps and extensions are different. Extensions can extend the browser functionality, but apps are like programs.
On App Service Internals you can see the list of all apps with information such as AppType, AppId, Readiness, Name, ShortName, PublisherId, Description, Version, AdditionalSearchTerms, LastLaunchTime, InstallTime, Permissions, InstallReason, InstallSource, PolicyId InstalledInternally, IsPlatformApp, Recommendable, Searchable, ShowInLauncher, ShowInShelf, ShowInSearch, ShowInManagement, HandlesIntents, AllowUninstall, HasBadge, Paused, IntentFilters, conditions, ResizeLocked, WindowMode, RunOnOsLoginMode, App Size, and Data Size.
4. chrome://app-settings
It shows all settings of installed apps on the Chrome browser. By default, app settings are blocked.
5. chrome://apps
Chrome browser supports web apps, and you can install apps from its store. This URL shows the list of all apps installed by you including pre-installed or default apps.
6. chrome://attribution-internals
Attribution Reporting API Internals shows the information about Attribution Reporting. Third-party cookies are frequently used in ad conversion measurement. Third-party cookies are being restricted by browsers because they can be used to track users across sites and compromise user privacy. These measurements are made possible without the use of third-party cookies by the Attribution Reporting API.
On the attribution-internals page, you can check whether the service is enabled or disabled. You can also refresh all page data and clear attribution data.
If the service is enabled, you can see information like Active Sources, Source Registrations, Trigger Registrations, Event-Level Reports, Aggregatable Reports, Verbose Debug Reports, and OS Registrations.
7. chrome://autofill-internals
Chrome introduced the Autofill feature in 2011. This page shows the captured autofill logs. Note that, when autofill internals are closed, then logs will be cleared.
8. chrome://blob-internals
This page shows all the blobs. It is a large object and raw data. Well blobs are immutable and can be read as binary or text data.
9. chrome://bluetooth-internals
It shows if the PC has a Bluetooth adapter. You can see the adapter address, name, state, connected devices, and debug logs.
10. chrome://bookmarks
You can open all saved bookmarks with it. However, you can access the bookmarks by clicking on the menu (three dots) from the top right or by pressing Ctrl + Shift + B from the keyboard.
11. chrome://chrome-urls
It shows the list of URLs. It is the same as the chrome://about link.
12. chrome://components
You can see all the components that are required by Google Chrome. It displays all components with their versions and states. You can see whether the components are up to date or not. Otherwise, you can check for updates manually.
13. chrome://conflicts
It displays the list of all modules and renderer processes loaded into Chrome and tells if any conflicts occur. It also shows the third-party module features status.
14. chrome://connectors-internals
The Chrome Enterprise Connectors Framework is a set of connectors and APIs that make it easier to integrate the Chrome browser and ChromeOS with solution providers.
15. chrome://crashes
Chrome stores the crash reports and sends them to Google to debug the issues. So, on this page, you can see the recent Chrome crashes. It also displays the crash time and its status, whether the report is uploaded or not.
16. chrome://credits
The credit page displays all technologies (tools, libraries, engines, etc.) that are used in Google Chrome with the organization’s name, license, and homepage.
17. chrome://device-log
Chrome records all device log events. You can see all the logs from this page. Moreover, you can select the log level from error, user, event, and debug. It shows the logs of login, network, power, Bluetooth, USB, HID, printer, FIDO, and Serial.
18. chrome://dino
You can play the hidden Chrome game on this page. It shows the “No Internet” page with a Dinosaur game. After opening the page, just press the space key from the keyboard and play the game.
19. chrome://discards
It shows all opened tabs with discard count. It enables you to see whether the tabs were discarded or not. The page displays Discards, Database, and Graph tabs with detailed information.
You can see the utility rank, reactivation score, site engagement score, tab title and URL, visibility, loading state, lifecycle state, discards count, auto discardable, last active, and actions.
20. chrome://download-internals
It let you download any file by entering the link into the download field. You can see the service state, entry requests, and client ID. The page is especially for developers.
21. chrome://downloads
This will open the download page where you can see and open all your downloads. You can also access and open this page from the menu and press Ctrl + J from the keyboard.
22. chrome://extensions
Chrome supported extensions to extend its features. You can install extensions from its store. This page will open the extensions page from where you can see and enable/disable all installed extensions.
23. chrome://extensions-internals
It shows the hidden information of installed extensions on the Chrome browser.
24. chrome://family-link-user-internals
It allows Chrome to detect whether the user is a child or not. On this internal page, you can check whether Child detection is enabled or disabled. This also displays additional information such as Profile, Filter, User Information, and Filtering Results.
25. chrome://flags
Flags are experimental features that are hidden from normal users. You can’t find flags from settings. The Chrome developers team added under-development features in flags and continuously made changes to it. So, from this page, you can see, enable, and use in-development features to enhance your browsing experience.
26. chrome://gcm-internals
GCM (Google Cloud Messaging) internals display the information that is used to send push notifications. You can see all registered app IDs on this page. GCM Internals shows the device info, check-in log, connection log, registration log, receive message log, message decryption failure log, and send message log.
27. chrome://gpu
GPU (Graphics processing unit) internal page gives information about the device graphics feature status, driver bug workaround, problems detected, and ANGLE features. You can know whether your PC uses hardware-accelerated features for Canvas, Composting, Rasterization, Video Decode, WebGL, and WebGL2.
28. chrome://help
This will open the About Chrome page where you can see the browser version and know whether Chrome is up to date or not. You can also update the browser from this page. Alternatively, you can open this page by clicking on the three vertical dots from the top right.
29. chrome://histograms
Generally, Histogram is a representation of the distribution of numerical data. So, in the Chrome browser, the histograms page displays the stats fetches from the browser startup to the previous page load.
30. chrome://history
This will open the browsing history page. Every browser stored the history of the websites you visited. From this page, you can clear your browsing history as well. Alternatively, you can open history by pressing Ctrl + H from the keyboard, which is more convenient.
31. chrome://history-clusters-internals
It displays the history clusters internals page with Debug Logs. By default, the History Clusters internals page feature is turned off. If the service is enabled, you can do other tasks such as Dump Page, Dump Visits JSON, Dump Most Recent Context Clusters JSON, and Print Keyword Bag State.
32. chrome://indexeddb-internals
Some websites, web apps, and extensions store their data locally on a PC and create database files. This page shows the list of websites that create a database file on your PC. It also displays the website URL, database file size, and paths with force close and download options.
33. chrome://inspect
Inspect page is for the developer’s use. This will open various developer tools that allow inspecting Devices, Pages, Extensions, Apps, Shared workers, Service workers, and others.
34. chrome://interstitials
Chrome gives a warning when you are trying to open unsafe websites. It shows different types of security warnings like malware, phishing, and malicious unwanted software. You can access all warning pages from this page. To see the warning page, you can select the interstitials SSL, Safe browsing (loud and quiet webview), Captive portal, Lookalike URLs warnings, and Insecure (Mixed) Form Submission Warnings.
35. chrome://invalidations
This page shows the invalidations debug information with log and detailed internal status of the browser service handlers.
36. chrome://local-state
It gives the local state information and tells whether the features are enabled or not. The information is provided in a programming language
37. chrome://management
If the browser is managed by a company or organization, then all activity of the device will be visible on this page.
38. chrome://media-engagement
The media engagement page shows the website’s list that plays media files. You can see the list of sessions with playbacks and no playbacks with information like origin, sessions, sessions with playback, last playback, and score.
39. chrome://media-internals
It displays the media internals functionality i.e. players, audio, video capture, and audio focus. You can see all media device capabilities from here. However, this functionality is now available in the Media tab of the developer tools. You need to enable the experiment in the dev tools settings.
40. chrome://metrics-internals
The metrics internal page displays the UMA and Variations summary with logs data. UMA (User Metrics Analysis) refers to user metrics that are reported in order to help improve the Chrome browser.
41. chrome://nacl
About Nacl page lists the information about Chrome and the Operating system version, and the information about Nacl ad PNaCl (Portable native client). It tells whether the portable client and portable native client are enabled or not.
42. chrome://net-export
Net export internal lists the captured Network Logs. So, you can see the future network activity log to a file on disk. The page displays detailed information about all network activity on the Chrome browser (including normal and incognito tabs), information about the network configuration, and visited URLs.
43. chrome://net-internals
You can see the network-related functionality on this page. It lists the events, proxy, DNS, Socket, and Domain security policy details. So, it allows clearing bad proxies, clearing host cache, closing idle sockets, flushing sockets pools, and HSTS/PKP information.
44. chrome://network-errors
It lists all network error response pages. You can open and check each response page individually.
45. chrome://new-tab-page
It simply opens a new tab in the browser. You can also open the new tab by pressing the + icon from the top or pressing the Ctrl + T from the keyboard.
46. chrome://new-tab-page-third-party
It displays the new tab page with installed third-party web apps on the homepage.
47. chrome://newtab
This is the same as the new tab page to open a new tab in the browser.
48. chrome://ntp-tiles-internals
Chrome browser shows the top sites visited by you on the new page tab. This page lists the websites that are displayed on the new page with the homepage URL and favicon URL.
49. chrome://omnibox
This page is for developers to check the Omnibox functionality and responses using various input parameters. You can copy, paste, and download the responses in JSON format.
50. chrome://optimization-guide-internals
It enables the optimization guide to debug flags to record debug messages from the browser startup. By default, this service is disabled. You can enable it from the Chrome Flags page. From the flags page, enable Enable optimization guide to debug logs (#optimization-guide-debug-logs) flag.
51. chrome://password-manager
It shows the list of password manager logs.
52. chrome://password-manager-internals
It displays the captured password manager logs. Note that logs will be cleared when all password manager internals pages are closed.
53. chrome://policy
You can see all Google Chrome active policies with policy name, value, source, level, and status. You can copy and export policies in JSON format.
54. chrome://predictors
Chrome has an auto-complete action predictor feature. This page lists the user text key strings that are used to predict the websites based on your past activities. You can see the user text, URL, hit count, miss count, and confidence details.
55. chrome://prefs-internals
It shows the set of Chrome preferences in JSON format.
56. chrome://print
It opens the Chrome print page. You can also open this page by pressing Ctrl + P from the keyboard. It allows you to print and save the web page or document file. It also offers some settings.
57. chrome://private-aggregation-internals
The Private Aggregation API collects aggregate data from worklets that have access to cross-site data. On the page, you can see the Aggregatable reports with Status, Report URL, Report Time, API identifier, API version, Contributions, and Report Body. You can also Refresh all page data and Clear all private aggregation data.
58. chrome://process-internals
Process internals list the site isolation information and frame trees. It tells about the Site Per Process and Isolates Origins.
59. chrome://profile-internals
It shows all profiles with person details such as Profile Path, Local Profile Name, Signin State, Signin Required, Gaia Name, Gaia Id, User Name, Hosted Domain, Supervised, Omitted, Ephemeral, User Accepted Account Management, KeepAlives, Signed Accounts, Loaded in Memory, Has Incognito Profile.
60. chrome://quota-internals
It gives a summary of storage usage and quota. You can see the free disk space for the Chrome profile directory with statistics. The “Test Storage Pressure Behavior” is another option to trigger the notification for any URL. The dump option is also available for data.
61. chrome://safe-browsing
It displays the safe browsing status information. The page offers many tabs that give details about safe browsing. The available tabs are Preferences, Database Manager, Hash cache, ClientSafeBrowsingReportRequests, Download protections, Password protections, RT Lookup, Referrer chain, Log message, Reporting events, and deep scans.
62. chrome://sandbox
It gives information about the sandbox status of various processes with process ID, type, name, sandbox type, lockdown, integrity, and migrations.
63. chrome://serviceworker-internals
ServiceWorker internals gives the lists of stored JavaScript files by all visited websites. You can unregister, start, and pause any JS from this page. The page also tells the basic information of each JS file like registration ID, installation and running status, and version.
64. chrome://settings
It opens the Chrome settings. Alternatively, you can open settings from the menu.
65. chrome://signin-internals
It gives all the information about your Chrome accounts. You can see the basic information, last sign-in details, access token details by account, account in the cookie jar, accounts in token service, and refresh token events.
66. chrome://site-engagement
It is the repository of the websites that tells the engagement of the websites. The list is based on the score you visited the websites.
67. chrome://suggest-internals
It will open the Suggest Internal Tool. You can see, filter, download, paste, and upload the information in JSON format.
68. chrome://sync-internals
It gives all detailed information about synchronization functionality on the Chrome browser. You can get the details from different tabs like About, Types, Data, Events, Sync NodeBrowser, Search, User Events, and Traffic Log.
69. chrome://system
It displays system diagnostic data with details. It shows the OS and Chrome versions, extensions, memory usage, and USB keyboard detected.
70. chrome://tab-search.top-chrome
It opens the search tabs. You can see the currently open tabs and recently closed tabs. You can also access this functionality by pressing Ctrl + Shift + A keyboard shortcut.
71. chrome://terms
It displays the Google Chrome terms and service page. However, you accepted all terms and conditions while installing the browser. But, you can read terms from here to know how your data is being used by Google.
72. chrome://topics-internals
Chrome introduced Topics in 2022 which is a new Privacy Sandbox proposal for interest-based advertising. Topics are not currently available by default in any Chrome version, but you can enable it in two ways: as a single user or at scale.
The Topics API Internals show the Topics State, Classifier, Features, and Parameters.
73. chrome://tracing
This will show you the browser activity if enabled. By default, the service is disabled. But you can enable it manually to get the browser activity like processes and flow events.
74. chrome://translate-internals
It gives translation-related information like languages that are not translated and the languages that are always translated. Moreover, you can get different types of log data like detection logs, event logs, error logs, and Init logs.
75. chrome://ukm
URL-Keyed Metrics give the metrics of events with history navigation information.
76. chrome://usb-internals
It shows the list of active USB devices on the PC that are supported by Chrome. You can also test new devices by adding a name, serial number, and landing page.
77. chrome://user-actions
It listens to the user actions (tab changed, tab click, browser changed, etc.) and shows the log data with a timestamp.
78. chrome://version
It displays detailed information on Chrome versions including Google Chrome version, Revision, OS, JavaScript, Flash, User-agent, Command line, Executable path, Profile path, and Variations.
79. chrome://web-app-internals
The web app internals page shows the installed app’s information in JSON format. You can download and copy the information.
80. chrome://webrtc-internals
Allows to read stats from Standardized (promise-based) getStats() API and Legacy Non-Standard (callback-based) getStats() API.
It also allows the developers to create the dump to enable the diagnostic audio recordings and diagnostic packet and event recording.
81. chrome://webrtc-logs
It displays recently captured WebRTC text and event logs.
82. chrome://whats-new
This page shows what’s new in the Chrome browser. You can check out the new and recent features added to the browser.
List of chrome://internals pages
1. chrome://internals/session-service
A list of open window sessions for the foreign device, ordered by most recently modified to least recently modified.
List of Chrome URLs for Debug
The debugging internals are not for normal users, because they can crash or hand the renderer. Chrome doesn’t link the debug URLs directly on the menu page. You need to type manually to the address bar.
- chrome://badcastcrash/
- chrome://inducebrowsercrashforrealz/
- chrome://inducebrowserdcheckforrealz/
- chrome://crash/
- chrome://crashdump/
- chrome://kill/
- chrome://hang/
- chrome://shorthang/
- chrome://gpuclean/
- chrome://gpucrash/
- chrome://gpuhang/
- chrome://memory-exhaust/
- chrome://memory-pressure-critical/
- chrome://memory-pressure-moderate/
- chrome://inducebrowserheapcorruption/
- chrome://crash/cfg
- chrome://heapcorruptioncrash/
- chrome://quit/
- chrome://restart/
Recently Eliminated Chrome URLs
- chrome://appcache-internals: You can see the application cache with details in it. When you open it, you’ll see all the web app’s cache that is stored in Chrome cache. It also displays the memory size, creation time, last access time, update time, and token expiration.
- chrome://conversion-internals: This internal shows the click-through conversion measurements. You can measure and report ad-click conversions. It uses an event-level API.
- chrome://devices: This page enables you to see the cloud printing devices that are connected to your PC. However, the service is discontinued by Google.
- chrome://interventions-internals: It displays the status and flags of the intervention (Previews allowed, NoScript Views, Enable resource loading hints, Ignore previews blocklist, Override effective connection type, and enable-data-reduction-proxy-server-experiment) with logs. This internal page also tells you about the user blocklisted status and network quality.
- chrome://network-error: It simply displays the network error response page. When the site can’t be reached by the Chrome browser, it shows the network error page.
- chrome://suggestions: It gives the expiry suggestions with the website URLs.
- chrome://supervised-user-internals: Offers information about the user. Currently, the feature isn’t working.
- chrome://ppapiflashcrash
- chrome://ppapiflashhang
Final Words
Now you know what are Chrome URLs and their uses. You can find numerous hidden features and information on these internal pages.
Well, most of the internals are only for developers. If you are a normal user, you may find that most of the URLs are not useful for you. Normal users can only bookmark some settings pages for faster access.
Google added new and removed the URLs in Chrome updates. So, you can see the changes in the list. Write in the comment section, what are your favorite Chrome URLs.
Popular on OTW Right Now!


About The Author
Gagan Bhangu
Founder of otechworld.com and managing editor. He is a tech geek, web-developer, and blogger. He holds a master's degree in computer applications and making money online since 2015.