
What Makes a Trading Indicator Useful? A Beginner’s Guide
A trading indicator is just a tool that turns raw price action into something easier to read. New traders often stack ten on one chart, hoping more information means better decisions. That rarely works as they expect.
This guide breaks down what actually makes an indicator worth your attention, the traits that separate a useful tool from noise, and how to build a setup that fits the way you actually trade instead of copying someone else’s chart.
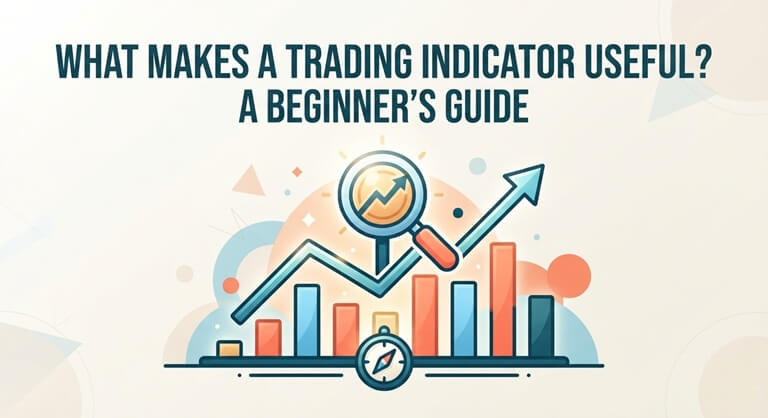
Understanding the Role of Indicators in Trading
At its simplest, a trading indicator takes price, volume, or both, and runs them through a formula to spot something the naked eye might miss. Some track momentum, some measure volatility, and others try to flag when a trend is losing steam. None of them predict the future. Each one organizes what already happened into a pattern you can act on.
That raw data on its own is messy. Price bars jump around, volume spikes for no obvious reason, and it’s easy to read too much into a single candle. An indicator smooths that noise into a line, a histogram, or a set of bands, giving you a cleaner picture of what the market has actually been doing over time.
Most beginners start by copying whatever setup a YouTuber or forum post recommends, which works fine until it doesn’t fit their own trading style. A better starting point is to browse the best TradingView indicators built for different strategies, then test a few that match how you already read charts instead of forcing yourself into someone else’s system.
It also helps to know whether a tool leads or lags. A leading indicator tries to signal a move before it fully develops, which sounds appealing but tends to throw out more false signals. A lagging indicator waits for confirmation, so it reacts a beat later but tends to be more reliable once a trend is already underway.
What Separates a Useful Indicator from a Cluttered Chart
A useful indicator provides a straight reading without any additional interpretation. If you need to strain to read the chart and you have to guess what the line crossing means, then the tool isn’t doing its job. The best indicators produce a one-sentence signal, not a paragraph of caveats.
Markets move through periods of stability and volatility, both up and down, and a good indicator is one that holds up in both periods. A few tools excel when the market is trending, and they blow up as soon as prices begin to move sideways. Testing an indicator in various circumstances – not only in the circumstance in which it turned out to look good – tells you much more about its actual value.
An indicator can be a great indicator and yet it may not be a great indicator for you. A scalper who trades on a 5-minute time frame requires a different kind of trading than a swing trader who invests for weeks or months. One reason people often add a new tool to their collection is that they saw it somewhere else and thought it looked cool. But before adding a new tool, ask yourself whether it fits your time frame and the setups you’re looking for.
Last but not least, a good indicator should not require constant care and attention. If you are changing settings to accommodate each session to get the signals to match what has already occurred, the tool is no longer assisting you; it’s just playing along with you! Once it is set, it is tested properly and adjusted only in response to a real market change.
Common Mistakes Beginners Make with Indicators
The most common error is adding indicators until the chart resembles a control panel. Five momentum tools in a row don’t deliver five times the information; they often deliver the same signal in various colors, or worse yet, the opposite signal, causing you to second-guess all of your trades.
Another bad habit that gets beginners in trouble is trading off the indicator instead of the trend. They jump in right away, and a signal fires, and that’s it; they jump in without checking if the price is confirmation of that jump. Indicators are best used as a support, not as the sole decision maker for when to enter or exit.
The other type of error is a “skipped” math one, which is a subtler error, but carries the same cost. Anyone who is not aware that a moving average is a designed lagger will be misled if it shows a lagging reaction to a sharp turnaround. Knowing the basic calculation of a tool will make you know precisely when to believe it, and when to anticipate it falling behind.
But the most common mistake is to consider any indicator as a certainty rather than a possibility. Any good system will have losing streaks, and markets are affected by too many factors to be captured by any formula. Indicators don’t eliminate risk, and no beginner thinks they will; they increase the odds over time.
How to Test an Indicator Before Trusting It
Always test any indicator with past price information before using it with real cash. Take out a chart and then scroll back several months and manually draw in all the indicator signals you received. That workout typically reveals more about a tool’s true performance than 10 online reviews.
Checking an indicator’s performance across several time frames is also a good idea. What looks like a reliable indication on a daily chart can be nothing more than noise on a five-minute chart, where these short time periods have more noise. If you’ve been using the tool for a couple of time periods, you can determine if it’s the best fit for your trading style.
Some indicators repaint; that is, they can come up with a new signal without you even noticing the change when new price information is loaded. Catch it early; otherwise, it may be close to useless when you need to repaint it in real time, but look great in retrospect. You can usually resolve it quickly by checking the documentation or asking in a community forum.
After using a tool, keep a rather straightforward record of its performance, trade by trade. Write it down, observe the setup, the signal, and the result, and check it periodically, e.g. every week or two. This will allow you to see patterns emerging quickly, and within a month or two you will see if an indicator makes the cut to be a permanent fixture on your chart.
Combining Indicators the Right Way
Combining a trend indicator with a momentum indicator is better than having two trend indicators or two momentum indicators. A trend tool will let you know where the trend is heading, and a momentum tool will indicate whether the trend move is getting stronger or not. As a team, they solve two questions rather than one twice.
Be careful not to use two similar math tools, since they’ll likely agree without adding new information. A fast moving average, a slow moving average, and an oscillator based on a moving average can seem comprehensive, but are merely repeating the same signal in three different forms.
There is a sweet spot between simplicity and sufficient confirmation to be confident in a signal. The combination of 2 or 3 well-targeted instruments which resolve 2 or 3 separate questions typically outperforms 5 instruments that all measure some variant of momentum. Simplicity makes for quick decisions, and a little confirmation helps to prevent rash decisions.
Various assets also require various mixtures. An indicator that works well in a stable currency pair may need adjustment for a highly volatile currency pair that moves much more in a single session. Instead, the specific asset you are considering trading matters more than assuming a setup will work across an untouched asset.
WrapUp
A helpful indicator must send solid signals, hold up under varying conditions, and ultimately work for how you’re actually trading. That’s not something that happens, and it’s not something that’s kept unless it’s tested first and has proven to be useful.
Be small, test out anything before putting it into your real trades, and keep cutting variables to what works. Pick a few tools that you know and feel comfortable with, and don’t overload a chart with signals you don’t fully grasp.
Popular on OTW Right Now!


About The Author

Gagan Bhangu
Founder of otechworld.com and managing editor. He is a tech geek, web-developer, and blogger. He holds a master's degree in computer applications and making money online since 2015.