
Shop Floor Productivity Metrics: 10 KPIs Plant Managers Should Track
Manufacturing productivity metrics measure how effectively a factory converts labor, machines, materials, time, and capacity into usable output. The most useful metrics are not simply the ones that produce the biggest numbers; they are the KPIs that help plant managers identify lost capacity, quality problems, downtime, and production bottlenecks.
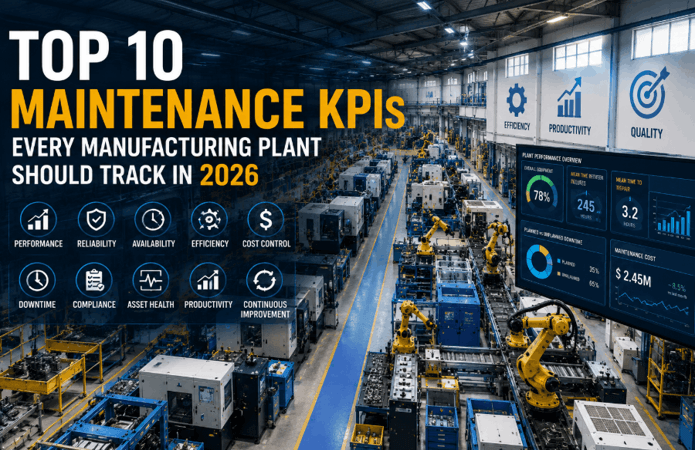
What are the key manufacturing metrics?
The key manufacturing metrics are OEE, throughput, cycle time, first-pass yield, scrap rate, downtime, availability, schedule attainment, labor productivity, and changeover time.
A plant does not necessarily need dozens of KPIs. A focused dashboard can provide a much clearer picture of performance.
The most important principle is to connect each metric to an operational decision. If a KPI changes but nobody knows what action to take, it is probably not a useful shop floor KPI.
What are the top manufacturing metrics kpi teams track?
The following 10 manufacturing metrics provide a practical starting point for most discrete-production environments.
1. Overall equipment effectiveness
OEE combines availability, performance, and quality:
OEE = Availability × Performance × Quality
It helps show how much of a machine’s planned production time is actually producing good parts at the expected rate.
OEE is particularly useful because it separates three different sources of loss instead of treating every lost production minute as the same problem.
2. Throughput
Throughput measures how much usable product the factory produces during a defined period.
A simple formula is:
Throughput = Good units produced ÷ Time
Track throughput by machine, line, shift, product family, or plant depending on the management question.
A rising throughput number is not automatically positive if scrap or rework is rising at the same time.
3. First-pass yield
First-pass yield measures the percentage of units that meet requirements without rework.
FPY = Good units produced without rework ÷ Total units entering the process × 100
FPY is especially useful for finding processes that appear productive because they produce a high quantity but require substantial rework before shipment.
4. Scrap rate
Scrap rate measures material or units that cannot be recovered economically.
Scrap rate = Scrap units ÷ Total units produced × 100
For high-value materials, tracking scrap by weight or monetary value can be more useful than simply counting parts.
A plant should also separate process scrap from startup scrap, engineering trials, damaged material, and other categories where possible.
5. Unplanned downtime
Unplanned downtime measures production time lost because equipment or processes were not available as planned.
Track both:
- Total downtime hours
- Downtime by reason
The second number is often more actionable.
If machine failures represent 40% of downtime, maintenance may be the priority. If changeovers dominate, the improvement project should be different.
6. Cycle time
Cycle time measures how long it takes to complete a production operation or unit.
Cycle time = Production time ÷ Units produced
Compare actual cycle time with the standard or target cycle time.
If actual cycle time gradually increases, the process may be experiencing tooling wear, material changes, operator issues, machine degradation, or another constraint.
7. Schedule attainment
Schedule attainment measures how closely actual production matches the planned production schedule.
Schedule attainment = Actual completed quantity ÷ Planned quantity × 100
This KPI is valuable because a factory can have excellent individual machine metrics while still missing customer commitments because production is happening in the wrong sequence or on the wrong jobs.
8. Labor productivity
Labor productivity measures output relative to the labor input used to produce it.
A simple manufacturing version is:
Labor productivity = Good units produced ÷ Direct labor hours
For products with significantly different values or processing requirements, revenue or standard hours may provide a more meaningful denominator than raw unit count.
9. Changeover time
Changeover time is the time required to switch equipment from one product, job, tooling configuration, or process setup to another.
Reducing changeover time increases productive capacity without necessarily purchasing another machine.
Track:
Last good part from Job A » First acceptable part from Job B
That makes the metric more meaningful than simply measuring how long someone spends changing tools.
10. On-time completion
On-time completion measures whether production orders or operations finish when promised.
On-time completion = Orders completed on time ÷ Total orders due × 100
This connects shop floor performance to customer service.
A plant that optimizes machine utilization while routinely missing promised completion dates may be optimizing the wrong objective.
How do you improve productivity manufacturing teams?
Improve manufacturing productivity by identifying the largest source of lost capacity and attacking that loss first.
Start by separating losses into categories such as:
- Equipment failures
- Waiting
- Material shortages
- Quality problems
- Changeovers
- Slow cycles
- Labor constraints
- Planning issues
- Maintenance
- Rework
Then rank the losses by hours or financial impact.
For example, if a line loses 100 hours per month and 60 hours come from changeovers, reducing changeover time is likely to produce more value than spending months trying to improve minor cycle-time variations.
Productivity improvement works best when the KPI identifies the problem and the production team has authority to address it.
Where can I find a manufacturing metrics list?
A useful manufacturing metrics list should cover productivity, quality, maintenance, delivery, inventory, and safety rather than focusing exclusively on production volume.
For shop floor productivity, start with:
- OEE
- Throughput
- FPY
- Scrap
- Downtime
- Cycle time
- Schedule attainment
- Labor productivity
- Changeover time
- On-time completion
Then add specialized metrics only when they answer a real management question.
Industry organizations and manufacturing software providers publish broader KPI libraries, but plant managers should avoid copying a large list without deciding how each metric will be used.
Where can I find a manufacturing metrics dashboard?
A manufacturing metrics dashboard should put the most actionable KPIs where supervisors and managers can see them quickly.
A useful dashboard typically contains:
Production: throughput, plan versus actual, cycle time
Equipment: OEE, availability, downtime
Quality: FPY, scrap, rework
Delivery: schedule attainment, on-time completion
Labor: labor productivity, hours versus standard
The dashboard should also provide drill-down capability.
For example, if OEE drops, the user should be able to identify whether availability, performance, or quality caused the change.
What are the key manufacturing efficiency metrics?
The key manufacturing efficiency metrics are the measures that show how effectively available production resources are being used.
Important examples include:
- OEE
- Machine availability
- Throughput
- Cycle time
- Labor productivity
- Changeover time
- Capacity utilization
- Scrap rate
- Energy per unit
Efficiency metrics should be interpreted alongside quality and delivery metrics.
Producing more units per hour is not an improvement if the additional output creates more defects or missed customer requirements.
What are the key manufacturing performance metrics?
The key manufacturing performance metrics combine production, quality, equipment, labor, and delivery results.
A balanced manufacturing scorecard can include:
- OEE
- Throughput
- First-pass yield
- Scrap rate
- Downtime
- Cycle time
- Schedule attainment
- Labor productivity
- Changeover time
- On-time completion
This combination prevents management from relying on production volume alone.
What are the key manufacturing productivity measures?
The key manufacturing productivity measures are output, time, labor, machine utilization, and quality measures viewed together.
For example, two factories may each produce 10,000 parts per month.
Factory A uses 1,000 labor hours and produces 2% scrap.
Factory B uses 1,500 labor hours and produces 8% scrap.
Looking only at output makes the factories appear identical. Productivity metrics reveal a very different operational picture.
This is why good KPI systems connect output to the resources and losses required to produce it.
What are the manufacturing metrics best practices?
Manufacturing metrics work best when teams follow a few basic rules.
Define every KPI clearly. Everyone should know exactly what counts and what does not.
Use consistent formulas. A metric that changes definition between shifts cannot support reliable decisions.
Separate leading and lagging indicators. Downtime is a lagging result; maintenance condition indicators can provide earlier warning.
Assign ownership. Every important KPI should have someone responsible for investigating deterioration.
Use the right time interval. A monthly metric can hide problems that require action today.
Avoid KPI overload. Ten useful metrics are usually better than 50 poorly understood ones.
Connect KPIs to action. Every red indicator should lead to a defined investigation or improvement process.
What are the 5 key performance indicators for manufacturing?
Five strong manufacturing KPIs are OEE, throughput, first-pass yield, unplanned downtime, and schedule attainment.
Together they answer five fundamental questions:
- Are machines being used effectively?
- How much are we producing?
- Are we producing acceptable parts the first time?
- How much capacity are we losing?
- Are we producing what was planned when it was needed?
Other KPIs can then be added based on the plant’s constraints.
A job shop may need more emphasis on setup time and on-time completion, while a high-volume automated plant may prioritize OEE, cycle time, and downtime.
What are the main manufacturing kpi formulas?
The main manufacturing KPI formulas include:
OEE = Availability × Performance × Quality
Throughput = Good units ÷ Production time
FPY = Good units without rework ÷ Total units entering process × 100
Scrap rate = Scrap units ÷ Total units produced × 100
Labor productivity = Good output ÷ Direct labor hours
Schedule attainment = Actual completed quantity ÷ Planned quantity × 100
On-time completion = Orders completed on time ÷ Orders due × 100
The exact formula should be documented internally because companies can define terms such as planned production time, good units, and rework differently.
What are some manufacturing kpi dashboard examples?
A useful shift dashboard might show:
Production: actual versus plan, throughput, cycle time
Quality: FPY, scrap, rework
Equipment: OEE, downtime, availability
Delivery: schedule attainment
Labor: direct hours and labor productivity
A plant-manager dashboard can then aggregate these numbers by production line, product family, shift, machine, or site.
The most useful dashboards also show trends rather than isolated numbers. A single day’s OEE may be less informative than a four-week trend that reveals a gradual decline.
What are some manufacturing productivity metrics examples?
Examples of manufacturing productivity metrics include:
- Good parts per labor hour
- Good parts per machine hour
- Units per shift
- Cycle time per part
- OEE
- First-pass yield
- Scrap percentage
- Downtime hours
- Changeover minutes
- Schedule attainment
- On-time completion
- Energy consumed per unit
Choose metrics according to the bottleneck.
A factory with insufficient machine capacity needs different productivity measures from a factory whose biggest problem is labor availability or poor first-pass yield.
What is the manufacturing productivity metrics meaning in simple terms?
Manufacturing productivity metrics simply show how much useful output a factory gets from the time, labor, machines, materials, and capacity it uses.
In simple terms:
Resources used » production process » useful output
A productivity metric helps answer whether the factory is getting more useful output from the same resources—or losing capacity through downtime, scrap, waiting, slow cycles, or rework.
What are good manufacturing productivity metrics for employees?
Good employee-level manufacturing productivity metrics should measure controllable work without encouraging unsafe behavior or sacrificing quality.
Useful examples include:
- Standard hours achieved
- Good units produced
- First-pass yield
- Rework rate
- Attendance to assigned schedule
- Setup completion time
- Downtime response time
- Training completion
- Preventive-maintenance task completion
Avoid using raw production quantity as the only employee performance measure.
If employees are rewarded exclusively for speed, they may have an incentive to bypass quality checks, skip required procedures, or prioritize quantity over safe operation.
A better approach combines productivity with quality, safety, and process adherence.
Build the KPI dashboard around the factory’s biggest loss
Manufacturing productivity metrics are most valuable when they lead directly to improvement.
Start with the 10 core KPIs—OEE, throughput, FPY, scrap, downtime, cycle time, schedule attainment, labor productivity, changeover time, and on-time completion. Establish consistent formulas, assign ownership, and drill into the causes behind unfavorable results.
Then use the data to prioritize the biggest source of lost capacity.
If downtime is the problem, improve reliability. If changeovers consume capacity, reduce setup time. If FPY is poor, address the process creating defects. If production is healthy but deliveries are late, examine scheduling and flow.
The objective is not to build the biggest dashboard. It is to build a small set of manufacturing productivity metrics that tell the team what to fix next.
Popular on OTW Right Now!




About The Author

Gagan Bhangu
Founder of otechworld.com and managing editor. He is a tech geek, web-developer, and blogger. He holds a master's degree in computer applications and making money online since 2015.