
Institutional Trading: Visualising Wholesale Order Flow and Execution Dynamics
Table of Contents
- Quick Summary: What Is Institutional Trading?
- Institutional Investment Trading: Core Definitions and Market Impact
- Wholesale Financial Market Operations: The Plumbing of High-Volume Clearing
- Capital Market Structures: The Macro Environment for Tier-One Capital
- Large-Scale Asset Management: Portfolio Shifts and Liquidity Demands
- Dark Pool Liquidity Mechanics: Navigating Non-Displayed Liquidity Pools
- Algorithmic Execution Benchmarks: VWAP, TWAP: Minimizing Market Footprint
- How to Track Institutional Order Flow: Reading Real-Time Footprints
- Institutional vs Retail Execution Differences: Spreads, Latency, and Order Routing
- Are You Looking for Trading Strategies or Regulatory Compliance Frameworks?
- Which Specific Asset Class Are You Analyzing?
- 5 Institutional Execution Tactics Active Traders Must Watch
- Platform Comparisons: Retail Technical Indicators vs Institutional Order Flow Mapping
- Bookmap Pricing and Access Tiers
- Global Accessibility and UK Support
- Why Choose Bookmap
- Trust, Industry Credentials, and Trustpilot Reviews
- Frequently Asked Questions
Quick Summary: What Is Institutional Trading?
Institutional trading involves the large-scale purchase and sale of financial assets by non-retail organizations such as investment banks, hedge funds, sovereign wealth funds, mutual funds, and pension fund managers. Since the scale of their trading would seriously disrupt ordinary retail trading channels, institutional traders use advanced order types, electronic execution algorithms, and private liquidity pools in order to reduce slippage. Given that their trading volume makes up the vast majority of total market turnover, it is important to be able to identify the footprints of institutional traders if genuine supply and demand are to be understood. Bookmap converts the complex microstructure of the exchange into an intuitive and high-resolution visual heatmap, enabling both retail and proprietary traders to monitor institutional liquidity, absorption, and iceberg orders in real time.
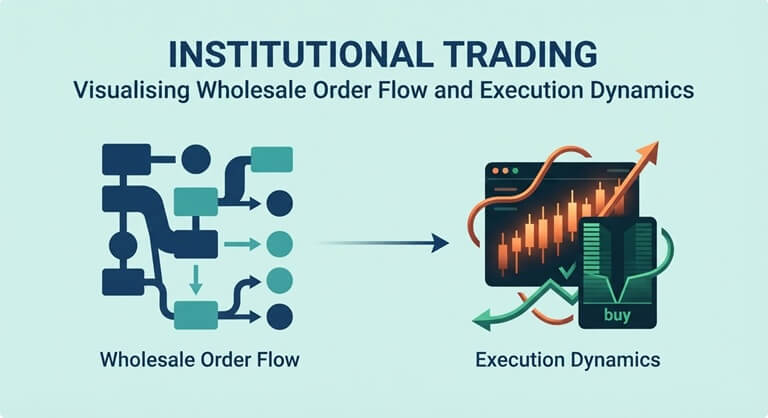
Institutional Investment Trading
Institutional investment trading involves the processes, infrastructure and strategies used by professional money managers when carrying out multi-million-pound positions on global exchanges. Instead of placing orders in the markets through ordinary retail market orders, institutional investment managers make use of direct market access (DMA), their relationships with prime brokers and multi-venue smart order routing.
The main aim of institutional investment trading is to carry out large transactions with as little effect on the market as possible. If an asset manager has to invest a large amount of capital in an equity or a commodity contract, purchasing all of the contracts at once would lead to immediate and unintentional price slippage. For this reason, institutional departments split their orders over time, across prices, and among different markets. By understanding these procedures, active participants are able to detect genuine institutional bias and then trade in line with the market-moving flow.
Traders who want to see how these blocks are routed can begin by using advanced visualization software that is set up for direct exchange feeds.
Wholesale Financial Market Operations
The operations of the wholesale financial market are akin to the underlying infrastructure that enables large-scale institutional trading. Different from retail brokerages which function as intermediaries, wholesale operations deal directly with one another via central clearing corporations, inter-dealer brokers, and custody banking networks.
Key elements of wholesale financial market operations include:
- Bilateral Credit Facilities: Prime brokers issue capital credit lines to hedge funds, enabling leverage and synthetic exposure via swaps and contracts for difference (CFDs).
- Continuous Net Settlement: Clearing houses net offsetting transactions between institutional members, reducing gross systemic credit risk and capital requirements.
- Tier-One Market Making: Global financial firms quote two-sided markets across futures, foreign exchange, and government debt, maintaining structural liquidity across major financial centers.
These operations make it possible for huge institutional block trades to be settled without putting the exchange’s solvency at risk, and thus form the fundamental foundation of the way international capital markets function.
Capital Market Structures
The legal frameworks, regulatory rules and trading environments in which institutional transactions take place are determined by the capital market structures. Depending on the type of instrument and the region in question, institutions carry out their activities in both the primary markets (which involve the first-time issuance of debt and equity) and the secondary markets (which cover ongoing trading on exchanges and other facilities).
Modern capital market structures are heavily fragmented:
- Lit Exchanges: Regulated public markets, such as the London Stock Exchange (LSE) and the New York Stock Exchange (NYSE), where orders are displayed in a transparent Limit Order Book (LOB).
- Multilateral Trading Facilities (MTFs): Alternative European trading venues providing high-speed matching systems often preferred by high-frequency market participants.
- Over-the-Counter (OTC) Networks: Off-exchange bilateral channels used extensively for complex derivatives, fixed-income products, and tailored currency swaps.
In order to deal with this fragmented market, institutional traders pass on the liquidity via cross-market arbitrage and use algorithmic execution systems in order to obtain the best current prices.
Large Scale Asset Management
Large-scale asset management consists of looking after investment portfolios amounting to billions of pounds on behalf of sovereign wealth funds, endowment funds, and pension schemes. Since these organizations deal with very large asset totals, careful planning is required when making adjustments to portfolios.
A core operational challenge in large-scale asset management is inventory risk. When an institution initiates an asset rebalancing program:
- Capital is deployed over multiple days or weeks to avoid triggering price spikes.
- Derivatives such as index futures or options are frequently deployed to establish immediate temporary beta exposure while cash positions are gradually built.
- Passive execution algorithms work limit orders behind the spread, waiting for impatient retail market orders to absorb the volume.
Before they are carried out, dark pools hide the orders, and the secondary impact of this volume eventually reaches the organized markets, producing noticeable absorption areas which visual systems are able to reveal.
Dark Pool Liquidity Mechanics
Dark pool liquidity mechanics govern transactions executed within non-displayed alternative trading systems (ATS). Unlike traditional lit exchanges, dark pools hide resting bids and offers from the public order book until the transaction has been matched and executed.
The mechanics function under specific structural rules:
- Absence of Pre-Trade Transparency: Limit orders resting in a dark pool do not publish price quotes to Level 2 data feeds, preventing front-running from short-term speculators.
- Midpoint Matching: Most crossing networks automatically execute trades at the exact midpoint of the National Best Bid and Offer (NBBO) established on lit venues, allowing institutions to avoid crossing the spread.
- Post-Trade Reporting: Once matched, transactions are reported to relevant trade reporting facilities (such as the FINRA Trade Reporting Facility in the US or European trade repositories) with minor delays.
While dark pools conceal orders before execution, the secondary footprint of this volume eventually ripples into lit markets, creating notable absorption zones that visual platforms can expose.
Algorithmic Execution Benchmarks VWAP TWAP
In order to keep the standards of execution in institutional trading operations at a high level, asset managers compare broker fills with standard algorithmic execution benchmarks such as VWAP and TWAP.
Volume-Weighted Average Price (VWAP)
VWAP calculates the average price an instrument traded at throughout the day, weighted by cumulative volume at each price tier:
$$\text{VWAP} = \frac{\sum (\text{Price} \times \text{Volume})}{\sum \text{Volume}}$$
Institutional execution desks aim to fill buy orders that are below the VWAP and sell orders that are above the VWAP. If a broker is unable to meet this target, they could lose their execution volume. As a result, institutional algorithms strongly defend the VWAP zones and turn the benchmark into a important intraday pivot.
Time-Weighted Average Price (TWAP)
TWAP breaks down large orders into smaller, equal-sized trade portions and spreads them evenly over a certain time period, even if there are fluctuations in volume. TWAP algorithms are especially popular when dealing with illiquid instruments or during overnight sessions since volume spikes are uncommon.
How to Track Institutional Order Flow
To learn how to track institutional order flow you have to stop relying on lagging technical oscillators and instead look directly at raw market depth and time-and-sales data; institutional traders cannot hide their volume, they can only split it up.
To track institutional order flow effectively:
- Identify Passive Iceberg Orders: Large traders place iceberg orders that reveal only a fraction of their total size to the public book. As market orders consume the visible display, the order automatically replenishes.
- Analyse Volume Absorption: When high aggressive market volume hits a specific price level without pushing price any further, a passive institutional participant is absorbing all available supply.
Using Bookmap, tracking institutional order flow becomes visually straightforward. The platform plots resting limit orders as a visual heatmap alongside real-time volume bubbles, making iceberg replenishment and volume absorption immediately visible.
Institutional vs Retail Execution Differences
The differences between institutional and retail order execution highlight the structural disparity within modern financial markets:
| Execution Feature | Retail Traders | Institutional Trading Desks |
| Order Routing | Payment for Order Flow (PFOF) / Internaliser retail brokers | Direct Market Access (DMA) and multi-venue smart order routing |
| Data Quality | Level 1 top-of-book or delayed snapshots | Unfiltered tick-by-tick Level 2 and Level 3 full depth data |
| Execution Tooling | Manual execution or simple stop/limit triggers | Custom execution algorithms (VWAP, TWAP, Implementation Shortfall) |
| Fee Architecture | Fixed per-trade commissions or widened retail spreads | Tiered exchange rebates for passive liquidity provision |
| Market Impact | Negligible; orders absorbed instantly into existing queues | Substantial; poorly routed orders distort spreads and move markets |
Are You Looking for Trading Strategies or Regulatory Compliance Frameworks?
Before studying institutional operations, clarify your primary operational objective:
- For Strategy and Microstructure Analysis: Your objective is uncovering actionable liquidity imbalances, tracking resting depth, understanding market-maker inventory balance, and aligning intraday positions with dominant algorithms.
- For Regulatory and Compliance Frameworks: Your focus rests on mandates such as the UK FCA Market Conduct Sourcebook, MiFID II best-execution obligations, trade reporting rules, and systemic anti-money-laundering controls.
Bookmap caters directly to traders seeking a strategic and analytical advantage. By transforming raw market depth into an intuitive visual stream, Bookmap bridges the gap between institutional data feeds and retail execution. If you need assistance structuring your analytical setup, you can speak to an expert directly.
Which Specific Asset Class Are You Analyzing?
Institutional operations vary significantly depending on the underlying financial asset class:
- Equities: Dominated by multi-exchange fragmentation, dark pools, and options-market market-maker delta hedging.
- Futures Contracts: Highly centralized, lit matching environments (such as CME or Eurex) with transparent Level 2 and Level 3 order books, making futures ideal for visual order flow tracking.
- Foreign Exchange (FX): Primarily an OTC, decentralized interbank market where tier-one liquidity providers quote streaming prices through bespoke electronic networks.
- Government Debt: Centered around primary dealer auctions and inter-dealer electronic platforms, where macroeconomic yields dictate pricing models.
Specifying your asset class ensures that you configure the right exchange connections and analytical metrics.
5 Institutional Execution Tactics Active Traders Must Watch
- Passive Absorption: Institutional limit buyers absorb aggressive retail panic selling at key structural levels, creating high-volume accumulation bands without price breaking lower.
- Liquidity Sweeps: Algorithmic programs trigger stops sitting above swing highs or below swing lows to engineer the exit liquidity needed to reverse positions.
- Iceberg Layering: Institutional algorithms deploy small clips across multiple sequential ticks to disguise large multi-thousand-lot buying programs.
- VWAP Anchoring: Large desks defend VWAP levels around corporate earnings or economic data prints to keep their average fill prices within institutional mandates.
- Quote Stuffing and Spoofing: Predatory participants rapidly post and cancel orders to create optical buying or selling pressure, attempting to manipulate price into resting orders.
Platform Comparisons: Retail Technical Indicators vs Institutional Order Flow Mapping
Standard charting indicators fail to reveal how institutional participants interact with order books, whereas visual order flow mapping presents live market dynamics clearly:
| Capability | Standard Retail Indicators (RSI, MACD, MA) | Bookmap Visual Order Flow Mapping |
| Information Timing | Lagging; calculated using past trade prints | Real-time; reveals current resting limit orders |
| Order Book Depth | None; displays historical candlestick bars only | Full visual Limit Order Book (LOB) heatmap |
| Iceberg Visibility | Completely invisible | Visualized via automated iceberg detection tools |
| Market Intent | Assumes future action matches past trends | Directly displays institutional bids, asks, and trade sizes |
| Execution Precision | Coarse; relies on arbitrary indicator crossovers | Precise; aligns entries behind verified resting institutional size |
Bookmap Pricing and Access Tiers
Bookmap provides transparent subscription packages tailored for active retail traders, proprietary prop teams, and institutional market participants:
- Bookmap Digital (Free): Tailored for cryptocurrency order flow analysis, providing real-time visual heatmaps and core volume indicators across major crypto exchanges.
- Bookmap Global ($49/month or discounted annual billing): Designed for active futures and equities day traders, featuring third-party broker integrations, volume delta tools, and customizable order flow modules.
- Bookmap Global+ ($99/month): Our full institutional solution, offering high-precision historical market replay, automated iceberg detectors, custom API connectivity for algorithmic trading, and priority technical support.
Traders looking to upgrade their market depth analysis can book a consultation to review individual operational requirements.
Global Accessibility and UK Support
Access to high-speed visual analytics must remain stable regardless of geographic location. Bookmap operates on global low-latency architecture, delivering dependable execution access across the United Kingdom, Europe, North America, and the Asia-Pacific region:
- UK & European Operations: Complete compatibility with leading brokers complying with UK FCA and ESMA frameworks, providing clean feeds for London Stock Exchange equities, Eurex contracts, and foreign exchange.
- Flexible Operating Environments: Run locally on high-performance desktop rigs or deploy on low-latency Virtual Private Servers (VPS) for consistent remote connectivity.
- Broad Data Provider Support: Compatible with top-tier financial data feeds including Rithmic, CQG, dxFeed, Interactive Brokers, and major cryptocurrency exchanges.
Why Choose Bookmap
Bookmap is widely regarded as a market-leading platform for visualising order book liquidity and market microstructure:
- Proven Technical Expertise: Built by quant developers and seasoned market professionals, Bookmap handles dense order updates per second without lagging or dropping data.
- Actionable Execution Clarity: Instead of guessing where institutional support sits, our patented heatmap visually charts genuine resting volume directly on your screen.
- A Groundbreaking Visual Approach: While standard charts show past prices, Bookmap reveals resting liquidity—the hidden limit orders that dictate future price movement.
- Speed and Execution Advantage: Make faster, more confident decisions around volatile market events by monitoring order book liquidity sweeps as they happen.
Elevate your market perspective and prepare for institutional order movements: get started with Bookmap today.
Trust, Industry Credentials, and Trustpilot Reviews
Platform reliability and data integrity are essential for active traders. Bookmap is trusted by retail traders, proprietary desks, and institutional trading firms globally:
- Positive Trustpilot Reviews: Over 600 Verified user testimonials on Trustpilot frequently highlight Bookmap for its reliable data streaming, responsive customer service, and the clear visibility it provides during volatile market sessions.
- Empirical Trade Verification: Every price line, volume bubble, and liquidity cluster reflects direct exchange trade prints. There are no lagging algorithms or repainted data points.
- Comprehensive Educational Support: Access extensive video libraries, live market analysis webinars, and an active trader community dedicated to mastering order flow dynamics.
Frequently Asked Questions
Can retail traders see institutional orders before they execute?
Certainly. If institutions submit resting limit orders to the exchange, then those orders will be included in the Limit Order Book (LOB). With Bookmap, the orders are shown visually as bright liquidity bands on the heatmap, enabling you to observe institutional support and resistance before the price moves.
How does Bookmap detect iceberg orders?
Bookmap monitors the ratio of the volume that has been executed to the size of the visible order book at each price level. If volume bubbles indicate a considerable amount of trade execution at a price level where resting liquidity is constantly being replenished without being used up, then our automated algorithms identify an iceberg order.
Why do institutional traders use dark pools instead of public exchanges?
In order not to show their intentions to the wider market, institutions use dark pools, thereby preventing other market participants from trading in front of their positions and causing the prices to move adversely.
Is Bookmap suitable for beginners learning institutional order flow?
Certainly. Although institutional traders use Bookmap for carrying out sophisticated depth analysis, beginning traders usually find our visual heatmap much easier to understand than the rapid numerical Level 2 ladders or the confusing candlestick chart patterns.
How do VWAP algorithms affect intraday price trends?
Institutions are benchmarked against VWAP. If a large buyer is executing a purchase program, their algorithm will actively buy whenever the price drops below VWAP to maintain an advantageous average, often establishing VWAP as a strong dynamic support line.
Can I backtest institutional trading patterns on historical data?
Yes. Bookmap includes an advanced historical replay mode that allows you to replay past trading days tick-by-tick at adjustable speeds, enabling you to study how institutions accumulate or distribute volume during major events without risking capital.
How do I contact the team for personalized onboarding?
You can easily speak to an expert or book a consultation directly through our dedicated support portal. Our technical team is available to assist with data feed configurations, broker setups, and chart layout optimizations.
Trade in Harmony with Institutional Market Liquidity
Relying on traditional lagging indicators leaves you blind to where institutional volume sits and how algorithms execute orders. By monitoring real-time order book depth, liquidity sweeps, and trade absorption, you can trade with clarity and control.
Get started with Bookmap today and discover the institutional order flow shaping modern capital markets.
Popular on OTW Right Now!




About The Author

Gagan Bhangu
Founder of otechworld.com and managing editor. He is a tech geek, web-developer, and blogger. He holds a master's degree in computer applications and making money online since 2015.