
Why 3D Load Visualization Reveals Problems Spreadsheets Cannot
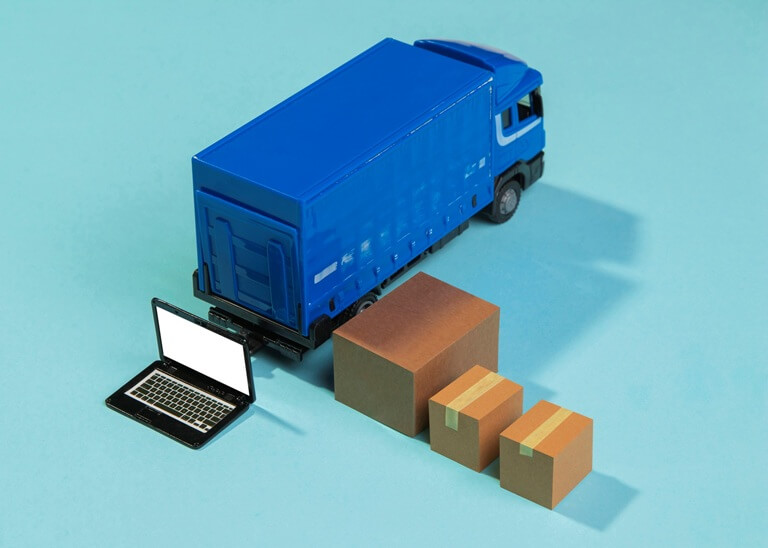
A spreadsheet shows that 58 cubic meters of cargo will fit into a space of about 64 cubic meters. In theory, that is acceptable since about 91% of the available volume is being used.
When the truck arrives, somebody notices the problem: one long crate blocks off useful space close to the wall, two box sizes cannot be stacked as they should be, and the cargo for the first delivery is located behind all the other stuff.
The figures were correct, but the mental image was not.
It is here that 3D load visualization proves to be valuable since it reveals the spatial conflicts that rows, formulas, and the totals of volume are not intended to display.
Volume Is Not the Same as Usable Space
Spreadsheets excel at handling quantities, dimensions, weights, SKUs, destinations, and costs. Problems start when you treat total volume as proof that a load will fit.
Consider a cargo compartment with dimensions 10.2 × 2.4 × 2.6 meters; the theoretical volume of this space is approximately 63.6 m³. Since the shipment amounts to 58 m³, the figures indicate that there should be sufficient room. However, cargo does not act in the same way as water poured into a tank; individual items have definite sizes, follow certain stacking rules, and are subject to restrictions regarding orientation.
It is possible for a long item to leave behind a space strip which, although technically empty, is of no use for the other boxes. A pallet that cannot be stacked wastes vertical space. The error consists in optimizing the total without first verifying the geometry.
The Problems Appear at the Edges
There are thirty cartons having similar footprints together with four larger ones. Although the spreadsheet records them accurately, it does not indicate whether the larger items should be placed first or whether they result in unusable pockets.
Multi-stop deliveries make this especially visible. If warehouse staff have to unload half the vehicle in order to get to the next customer’s shipment, then the load becomes operationally unsound.
Hence, experienced planners take into account sequence, the way loads are handled, stacking restrictions, weight distribution, and access for unloading.
What a Visual Plan Catches Faster
With load planning software, dimensions become objects inside a defined cargo space. Instead of mentally translating “1200 × 800 × 950 mm, quantity 12” into a layout, the planner can inspect the arrangement directly.
A narrow gap can now be seen, as well as a crate placed in a position that makes the following loading step difficult. The question then becomes whether the warehouse staff could actually load them in that order.
Visual plans also improve handovers. An experienced planner is able to understand a spreadsheet at once since they know the products, whereas someone working on a different shift won’t have that same mental model.
| Spreadsheet check | Visual load check |
| Total volume and weight | Where unused space appears |
| Item dimensions and quantities | How different shapes interact |
| Destination groups | Whether unloading order makes sense |
| Capacity formulas | Whether placement is practical |
The two views answer different questions.
When Cargo Loading Software Starts Making Business Sense
It may be unnecessary to use specialized cargo loading software if a company ships only a few box sizes into the same vehicle every week.
The case becomes stronger as variability grows. A distributor can be responsible for hundreds of SKUs. A manufacturer might combine pallets, crates, and cartons. And a 3PL will need plans that both warehouse teams, customers, and carriers are able to understand without having to receive a lengthy explanation.
The cost of poor planning is not only unused space. It can mean extra planning time, rework, loading delays, and dependence on one employee who “just knows” how difficult loads fit.
There’s also a consideration from the point of view of sustainability. Greater utilization doesn’t necessarily reduce emissions. Yet if better planning gets rid of an unnecessary vehicle or container, fewer transport trips can lead to lower fuel consumption and lower costs.
A Container Loading Calculator Should Support Judgment
A container loading calculator might at first seem to be no more than a matter of arithmetic. Still, useful tools go beyond this by enabling planners to examine the layout itself.
For example, EasyCargo includes an interactive 3D view of the loading process together with the possibility of applying loading constraints and grouping the cargo; this enables planners to examine a proposal before the warehouse assigns labor and equipment to it.
Software output does not replace expertise or compliance checks. A neat-looking arrangement can still be unsuitable if it ignores payload limits, axle loads, cargo securing requirements, hazardous-goods rules, or product-specific handling limits.
Transport guidance also emphasizes load stability, weight distribution, and securing. Simply making everything fit is not proof that a load is safe.
The Real Upgrade Is Visibility
Spreadsheets remain a practical way to prepare shipment data and run calculations. Their weakness is that physical space is three-dimensional.
Once planners are regularly sketching layouts, mentally rotating boxes, or discovering avoidable gaps at the dock, the workflow is asking for a visual layer.
For B2B logistics teams, the useful question is not “Should we stop using spreadsheets?” It is: “Which decisions are we still forcing people to make in their heads?”
When those decisions involve fit, sequence, orientation, or access, seeing the load before touching the cargo can prevent a spreadsheet-perfect plan from becoming a warehouse problem.
Sources
- https://www.easycargo3d.com/pt-pt/
- https://unece.org/transport/documents/standards/ctu-code
- https://road-safety.transport.ec.europa.eu/eu-road-safety-policy/priorities/safe-vehicles/cargo-securing-and-abnormal-loads_en
- https://www.gov.uk/guidance/securing-loads-on-hgvs-and-goods-vehicles/1-responsibility-for-load-security
Popular on OTW Right Now!




About The Author

Gagan Bhangu
Founder of otechworld.com and managing editor. He is a tech geek, web-developer, and blogger. He holds a master's degree in computer applications and making money online since 2015.